London’s most stressful Tube stations
Nothing says Tube travel like the stress of cramming yourself onto a carriage before the doors close on a line that’s been endlessly delayed. The London Underground is vital to life in the capital, but it’s also a significant source of daily distress for the enormous number of people who use it. And some stations are significantly worse than others.
Should you want to avoid raising your blood pressure as you navigate the city, we’ve looked at all the Tube stations across London to determine which ones are the most patience-testing to use. To determine our list, these are the factors measured over the course of a year:
- The amount of people entering and exiting the stations
- Negative and neutral social media mentions
- Total length of delays in minutes
We’ve then combined them to create an index out of three, with the higher number indicating a higher level of stress. Here’s what we found…
Kings Cross St Pancras is London’s most stressful Tube station
Topping the list of stressful Tube stations is Kings Cross St Pancras with an index score of 1.9. It was also the busiest station, with 97.92 million people entering and exiting the station over the course of 2017. Out of 268 tube stations across London, Kings Cross St Pancras was also the 17th worst for delays. It clocked 1,853 minutes of primary delays, which is where delays aren’t caused by other disruptions, between November 2017 and October 2018. There were also 144 mixed and negative mentions on social media over 2018.
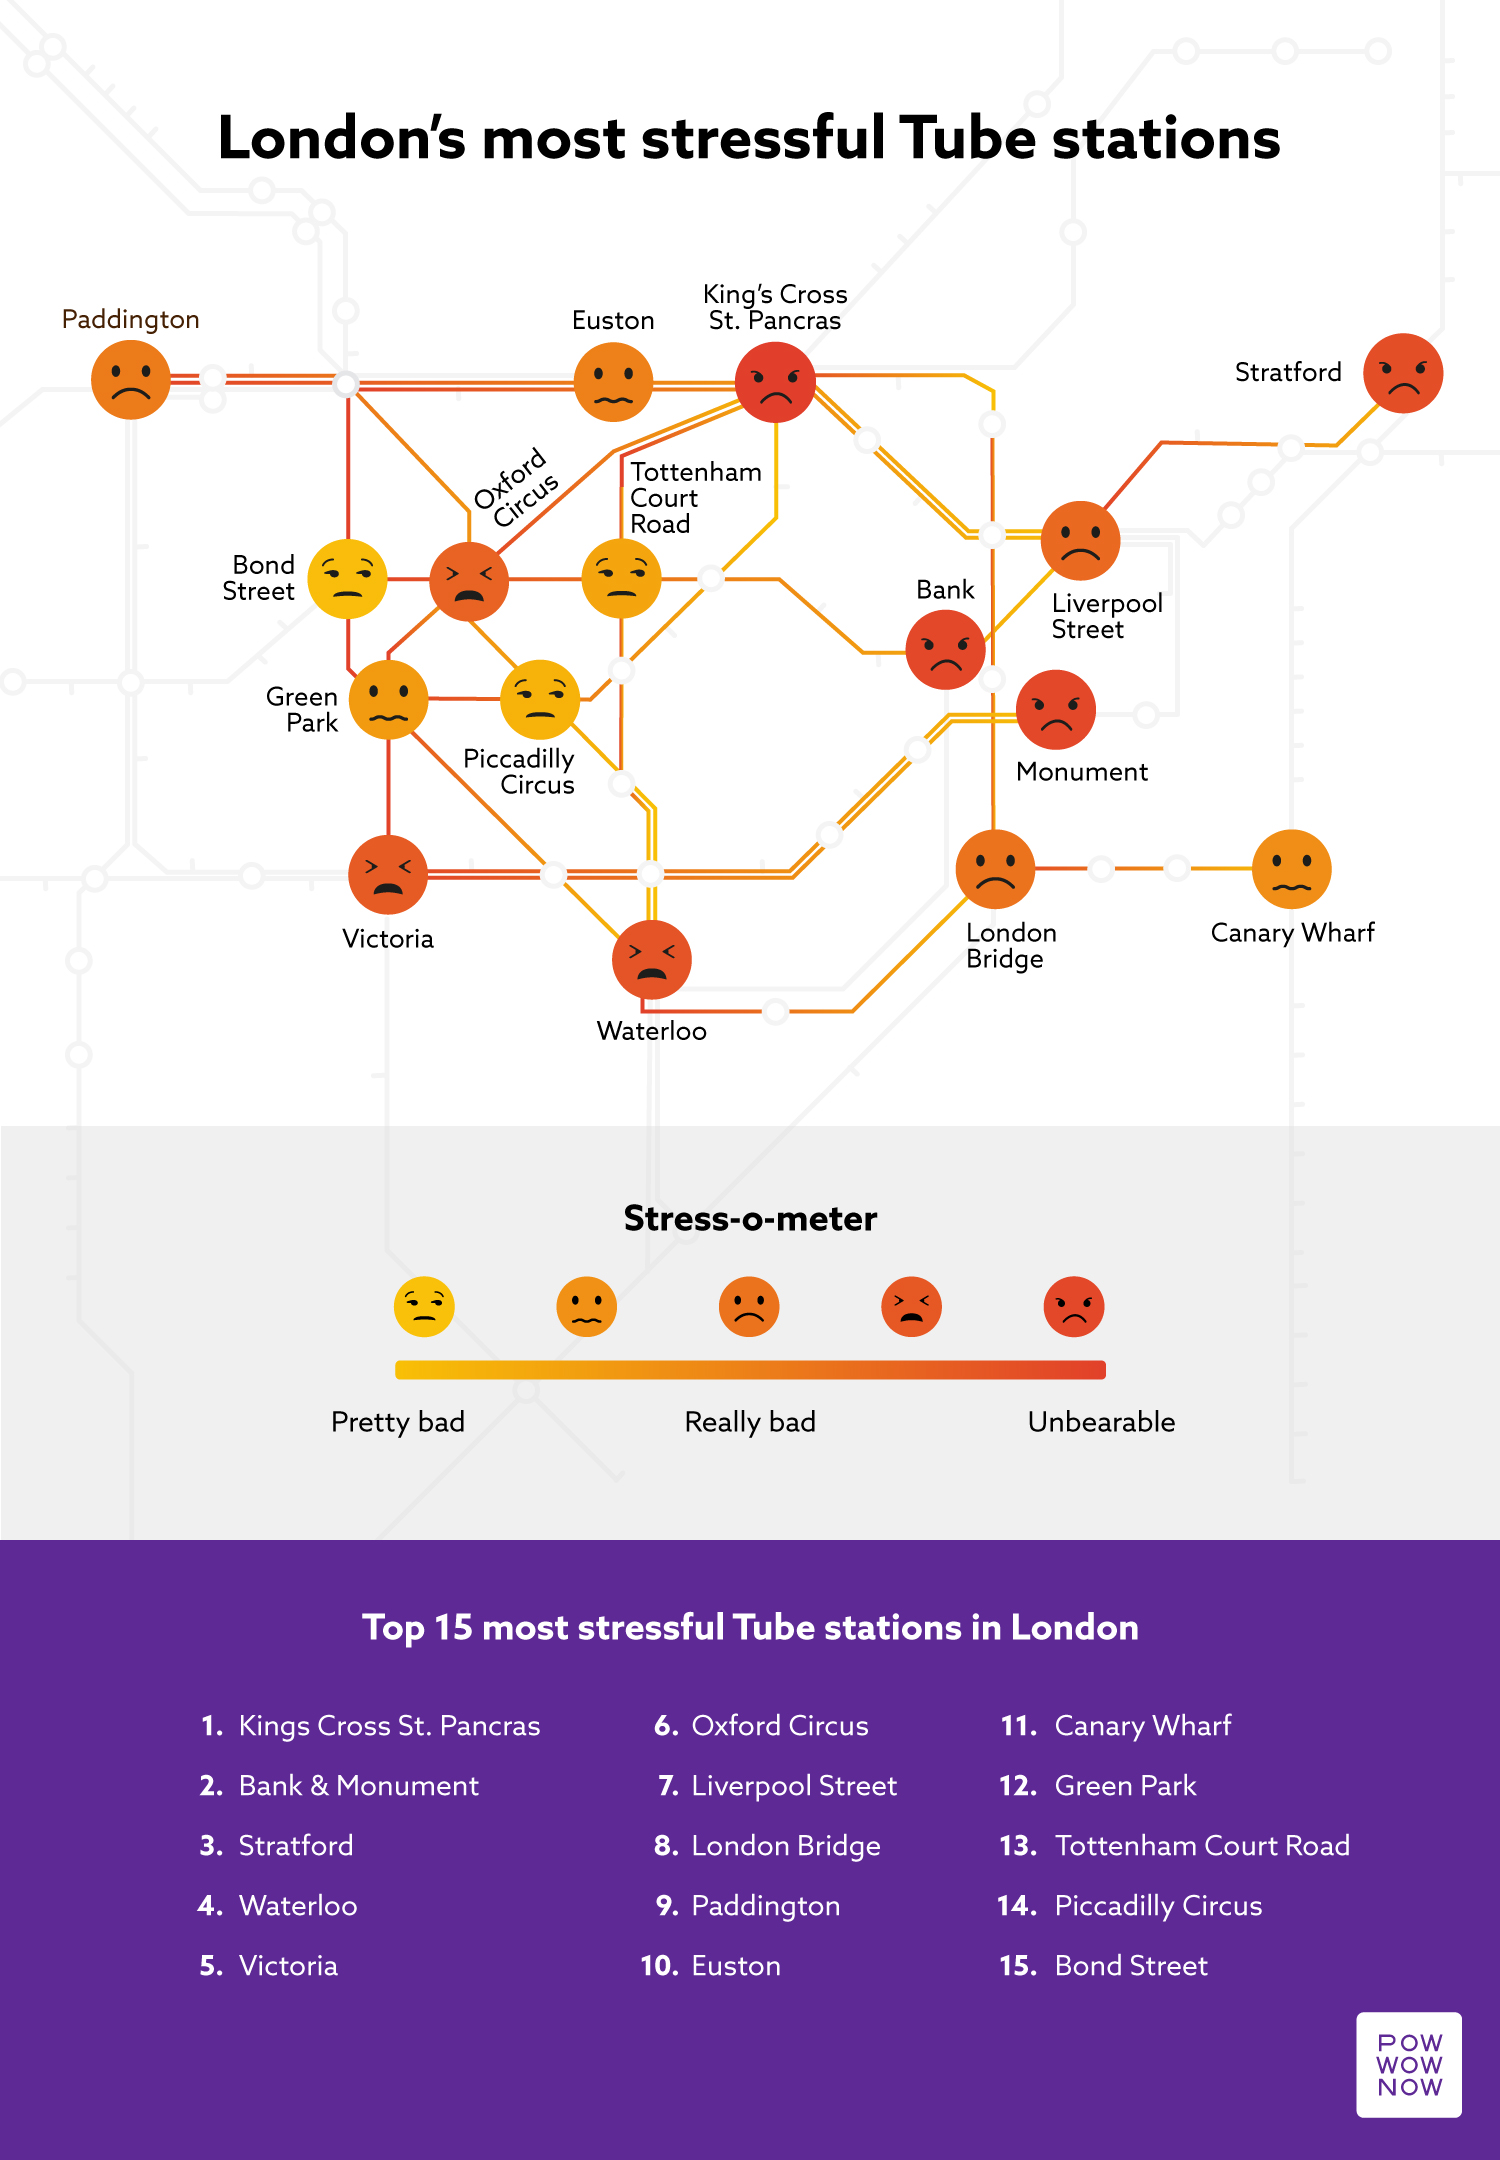
Another central London destination took second place, the interconnected Bank and Monument stations, with an index score of 1.89. Of the top 15, this station saw the most negative and mixed social media posts. Meanwhile, on the border of zones 2 and 3, Stratford took third place and was third worst for delays, clocking up 3,473 minutes.
The top 15 most stressful Tube stations are:
| Station | Annual entries and exits (millions) (2017) | Total train delay (primary delays) | Social media mentions (inc. reposts) | Index score (out of 3) |
| Kings Cross St. Pancras | 97.92 | 1,853 | 144 | 1.90 |
| Bank & Monument | 61.80 | 915 | 394 | 1.89 |
| Stratford | 61.99 | 3,473 | 49 | 1.76 |
| Waterloo | 91.27 | 1,405 | 101 | 1.59 |
| Victoria | 79.36 | 860 | 162 | 1.47 |
| Oxford Circus | 84.09 | 896 | 61 | 1.27 |
| Liverpool Street | 67.74 | 926 | 72 | 1.14 |
| London Bridge | 69.05 | 504 | 49 | 0.97 |
| Paddington | 48.82 | 547 | 101 | 0.91 |
| Euston | 43.07 | 788 | 75 | 0.86 |
| Canary Wharf | 50.91 | 586 | 43 | 0.80 |
| Green Park | 39.34 | 966 | 32 | 0.76 |
| Tottenham Court Road | 41.33 | 563 | 69 | 0.76 |
| Piccadilly Circus | 40.82 | 477 | 76 | 0.75 |
| Bond Street | 38.80 | 389 | 41 | 0.61 |
Where people are talking about on social media
Looking at the use of #station, #tube, and #train on social media and seeing which Tube stations were mentioned, we were able to work out which of the top 15 Tube stations were the most complained about. Bank and Monument saw the most mixed and negative mentions on social media. Victoria station took second place while Kings Cross St Pancras was in third.
London’s busiest stations
Attached to two large train stations, Kings Cross St Pancras Tube station saw the most entries and exits over the year. It topped the list with a staggering 97.92 million.
In fact, all the top three were central London stations that are often used by business travellers and tourists alike. Waterloo was the second busiest station, with 91.27 million entries and exits, while Oxford Circus was in third with 84.09 million entries and exits.
Which Tube station sees the most delays?
Looking at the stations that saw the most primary delays, it was revealed the worst station of all was Acton Town in zone 3 of West London, with a total of 4,432 minutes of delays. The North London zone 4 station Arnos Grove was in second place, with 3,843 minutes, while Stratford station, on the Central line and near the Eastern terminus of the Jubilee line, was in third with 3,473 minutes.
Which Tube stations see the least delays?
As delays can be such an aggravating factor when you’re trying to get to something important, it can be handy to know which stations have the most punctual service. The top three stations that performed well with this were all on the Central line. With only 17 minutes of delays across a year, the north-east London zone 4 station of Barkingside saw the least out of all of London’s Tube stops. Located in a similar area, Redbridge had the second least delays, with only two minutes more. Meanwhile, Essex’s Roding Valley station was in third place, with a mere 22 minutes of delays.
What’s notable about all the stations with the least delays is that fewer people are using them compared to the top 15 stations that cause the most stress, so it’s possible that this could have an effect. The table below shows which stations saw the least delays as well as the number of entries and exits in a year.
| Station | Annual entries and exits (millions) (2017) | Total train delay (primary delays) |
| Barkingside | 1.62 | 17 |
| Redbridge | 2.94 | 19 |
| Roding Valley | 0.37 | 22 |
| Chigwell | 0.50 | 29 |
| Park Royal | 2.02 | 34 |
| Ruislip Manor | 2.04 | 40 |
| Kew Gardens | 4.37 | 41 |
| Stamford Brook | 2.69 | 41 |
| Fulham Broadway | 9.63 | 50 |
| Sudbury Hill | 1.88 | 54 |
| Gunnersbury | 5.71 | 61 |
| North Wembley | 1.77 | 62 |
| Becontree | 3.64 | 63 |
| Greenford | 4.68 | 64 |
| Cannon Street | 9.39 | 67 |
Knowing which stations are most likely to test your patience could help you to work out a commute that’s more relaxed and can ensure you aren’t held up while trying to get where you need to go.
Many of the most stressful stations are located in central London and all of them serve a variety of lines. With more trains coming through, this naturally means that more people will be coming in and out of the stations and that the chances of delays at these stations is higher.
Many of these tube stations tend to be close to tourist destinations, so you might want to avoid them if you’re not sightseeing. Unfortunately, although not unsurprisingly, our top 15 stations that are worst for stress are also popular areas for business.
Of course, those people could skip the travel altogether. Our conference call software would ensure they’re always on time and able to have productive business meetings with people both in the capital and further afield.
Methodology
To create our index of London’s most stressful Tube stations, we combined data based on the number of people entering and exiting each station, the amount of primary delays in minutes and any negative or mixed mentions on social media.
We gathered statistics for the number of people using these stations in 2017 from Transport for London’s multi-year station entry and exit figures.
Using social listening tool Linkfluence, we were able to see which stations had the most negative mentions on social media alongside the hashtags #station, #tube, and #train.
To gather the data on the delays, we submitted a Freedom of Information request and to find out the total number of minutes of delays for each station.